NPR

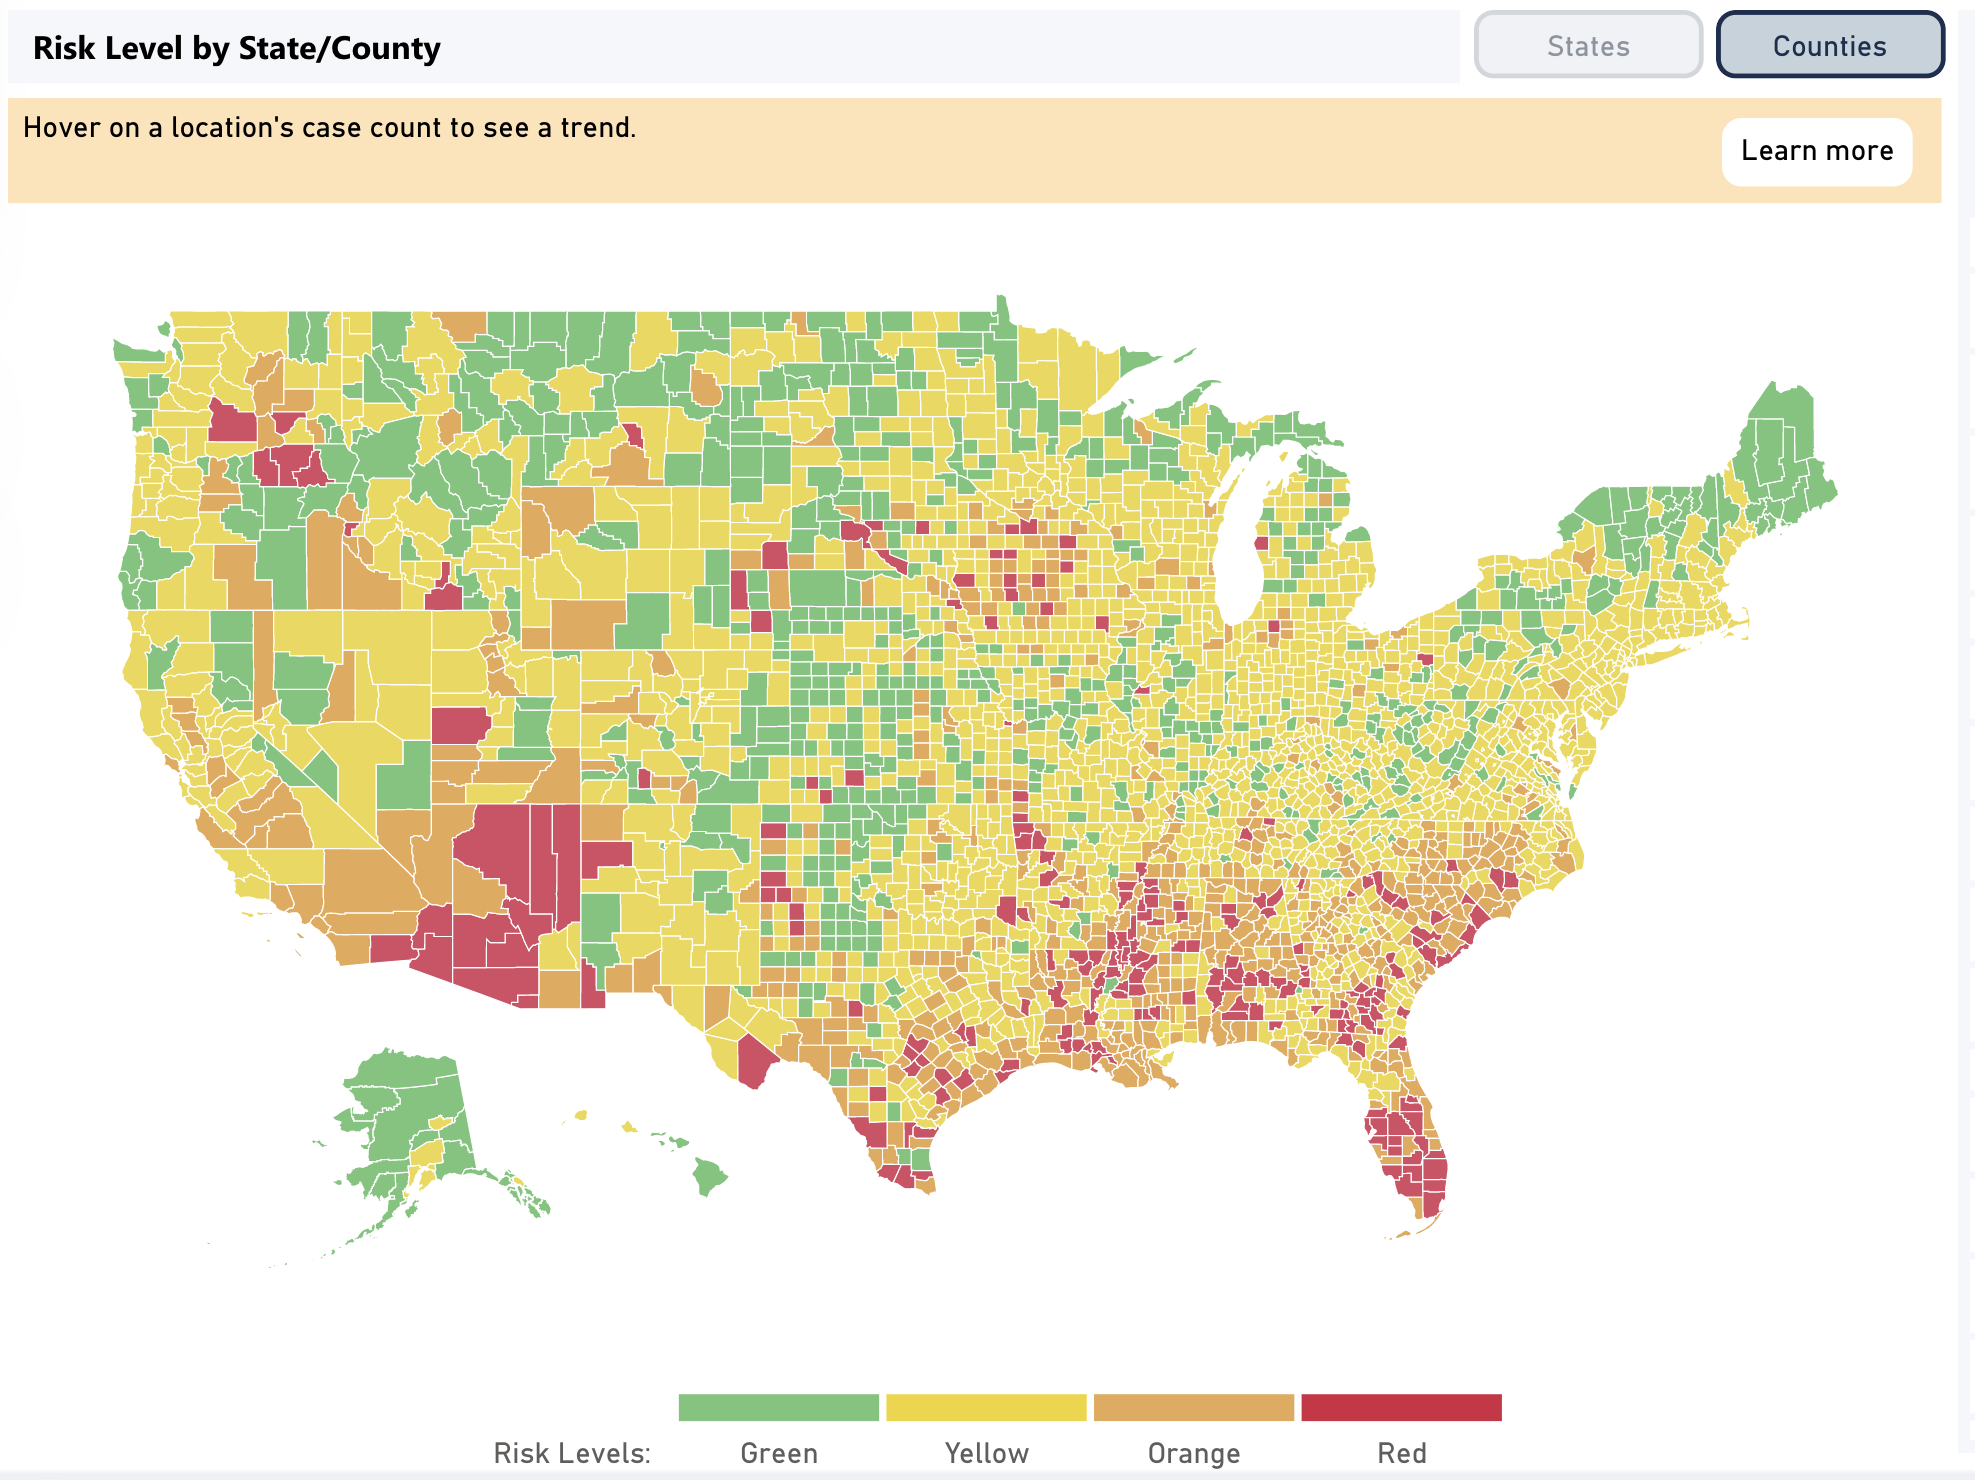
Green, Yellow, Orange or Red? This New Tool Shows COVID-19 Risk In Your County

As cases of coronavirus surge in many states, a new color-coding tool backed by a coalition of top scientists provides an apples-to-apples way of comparing outbreak severity, down to the county level.
This interactive map lets you find out how bad your county's coronavirus outbreak is.

How severe is the spread of COVID-19 in your community? If you're confused, you're not alone. Though state and local dashboards provide lots of numbers, from case counts to deaths, it's often unclear how to interpret them — and hard to compare them to other places.

"There hasn't been a unified, national approach to communicating risk, says Danielle Allen, a professor and director of Edmond J. Safra Center for Ethics at Harvard University. "That's made it harder for people," she says.

Allen, along with researchers at the Harvard Global Health Institute, is leading a collaboration

You’re reading a preview, subscribe to read more.

More from NPR

NPR4 min read
A Car-free Town In The Amazon Serves Lessons For Pedaling To Net Zero Emissions
Afuá, a remote town in the Brazilian Amazon, banned motor vehicles over 20 years ago. Writer Mac Margolis and photographer Stefan Kolumban paid the town a visit to see what life is like.
NPR17 min readAmerican Government
What Did Trump Say? Explaining The Former President's Favorite Talking Points
Former President Donald Trump continues to ratchet up his rhetoric on the campaign trail, but if someone doesn't follow Trump all the time, decoding his meaning can get confusing. We're here to help.
NPR2 min read
Hiking The Azores Into Lush Mountains And Stormy North Atlantic Weather
NPR correspondent Brian Mann went trekking on Sao Miguel, one of the most remote islands in the North Atlantic. He found volcanic mountains, birdsong, solitude and lots of rain.

Related Books & Audiobooks